Thick black line shows 2013 ice well above recent years, especially 2012 (green line).

"Sea ice extent in recent years for the northern hemisphere.
The grey shaded area corresponds to the climate
mean plus/minus 1 standard deviation."
"The plot above replaces an earlier sea ice extent plot, that was based on data with the coastal zones masked out. This coastal mask implied that the previous sea ice extent estimates were underestimated. The new plot displays absolute sea ice extent estimates. The old plot can still be viewed here for a while."
[Ed. note: Color of text above is as presented on the COI site.]
"Northern Hemisphere Sea Ice Extent"
"Total sea ice extent on the northern hemisphere during the past years, including climate mean; plus/minus 1 standard deviation. The ice extent values are calculated from the ice type data from the Ocean and Sea Ice, Satellite Application Facility (OSISAF), where areas with ice concentration higher than 15% are classified as ice.
The total area of sea ice is the sum of First Year Ice (FYI), Multi Year Ice (MYI) and the area of ambiguous ice types, from the OSISAF ice type product. The total sea ice extent can differ slightly from other sea ice extent estimates. Possible differences between this sea ice extent estimate and others are most likely caused by differences in algorithms and definitions. Some time in 2013 sea ice climatology and anomaly data will become available here." via commenter Jonas at NoTricksZone, 8/6/13, "Danish Meteorological Institute: Arctic Sea Ice Now 1.7 Million Square Kilometers Over Last Year!
==================================
Below is earlier version of COI August 2013 Arctic Ice referenced in headline of this post. COI text above in red notes earlier graph numbers (seen below) may have been underestimated. That language is also below in bold.
8/7/13, "Current Sea Ice," Northern Hemisphere, Center for Ocean and Ice, Denmark Meteorological Assn.
Thick black line shows Arctic Ice through early August 2013. It's significantly above the same date in recent years.
"Total sea ice extent on the northern hemisphere since 2005. The ice extent values are calculated from the ice type data from the Ocean and Sea Ice, Satellite Application Facility (OSISAF), where areas with ice concentration higher than 30% are classified as ice.
The total area of sea ice is the sum of First Year Ice (FYI), Multi Year Ice (MYI) and the area of ambiguous ice types, from the OSISAF ice type product. However, the total estimated ice area is underestimated due to unclassified coastal regions where mixed land/sea pixels confuse the applied ice type algorithm. The shown sea ice extent values are therefore recommended be used qualitatively in relation to ice extent values from other years shown in the figure."...
-----------------------------------------------
Scary climate headlines are attempts to divert US taxpayer dollars to the multi-trillion dollar industry which is imaginary US CO2 terror. No scare=no money. NOAA personnel try hard to make things sound scary but their own data don't confirm their 'fears' (reference NOAA graph below, global warming flat for 15 yrs.). The UK Guardian link is from Real Science. The UK Guardian isn't interested in saving the planet. It's interested in guiding expenditure of US taxpayer dollars and influencing US government:
8/7/13, "NOAA Reminds Us That They Have Degenerated Into A Propaganda Wing Of The White House," Real Science
8/6/13, "Noaa report says Arctic sea ice is disappearing at unprecedented pace," UK Guardian, Suzanne Goldenberg
The word "unprecedented" appears in the UK Guardian headline, but the article doesn't explain it means "unprecedented" since 1993. The satellite service used to compile data for this report, Aviso, only started measuring in 1993
:
"Monthly global sea level from 1993 through early 2013 compared to 1993-2012 average, based on AVISO data. Graph adapted from Figure 2.1(x) in BAMS State of the Climate in 2012. Since satellite-based global measurements began in 1993, global mean sea level has risen between 2.8 and 3.6 millimeters per year (0.11-0.14 inches/year)."...(end of page)
The report was assembled by 384 scientists from 52 countries under the auspices of the American Meteorological Society. NOAA edited the report. NOAA's graph (below) shows global temperatures flat since 1998. NOAA doesn't say this, it's what the graph shows.

8/2/13, "2012 State of the Climate: Earth's Surface Temperature," climate.gov, Osborne, Lindsey (source of graph showing no increase in global temperatures since 1998).
Source for sea level claims since 1993:
7/31/13, "2012 State of the Climate: Global Sea Level," climate.gov (NOAA), Rebecca Lindsey
============================
8/2/13, "State of the Climate in 2012: Highlights," climate.gov, NOAA
"Worldwide, 2012 was among the 10 warmest years on record according to the 2012 State of the Climate report released online today by the American Meteorological Society (AMS). The peer-reviewed report, with scientists from NOAA’s National Climatic Data Center in Asheville, NC serving as lead editors, was compiled by 384 scientists from 52 countries."...
=======================
Scientific consensus that global warming has 'paused':
4/25/2013, Congressional testimony citing 15 year global warming pause:
Dr. Judith Curry, 4/25/13, "STATEMENT TO THE SUBCOMMITTEE ON ENVIRONMENT COMMITTEE ON SCIENCE, SPACE AND TECHNOLOGY OF THE UNITED STATES HOUSE OF REPRESENTATIVES Hearing on “Policy Relevant Climate Issues in Context," Judith A. Curry, Georgia Institute of Technology
p. 3, "Since 1998 there has been no statistically significant increase in global surface temperature."...
================================
UN IPCC Chief notes 17 year pause in global warming:
2/21/13, “IPCC Head Pachauri Acknowledges Global Warming Standstill,” The Australian, Graham Lloyd
"The UN’s climate change chief, Rajendra Pachauri, has acknowledged a 17-year pause in global temperature rises, confirmed recently by Britain’s Met Office."...
-----------------------------------
UK Met Office notes pause in global warming since 1998:
1/18/13, “Climate change: scientists puzzle over halt in global warming,” Der Spiegel, by Axel Bojanowski (translation from German)
"The British Met Office forecast even more recently that the temperature interval could continue at a high level until the end of 2017 - despite the rapidly increasing emissions of greenhouse gases . Then global warming would pause 20 years."..."The exact reasons of the temperature standstill since 1998, are not yet understood, says climate researcher Doug Smith of the Met Office."...

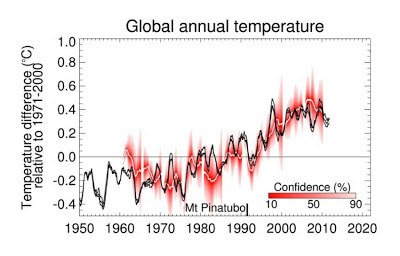
UK Met Office chart via Der Spiegel
==============================
11/19/12, “More than 1,000 New Coal Plants Planned Worldwide,” UK Guardian, Damian Carrington .
.
“India is planning 455 new plants compared to 363 in China, which is seeing a slowdown in its coal investments after a vast building program in the past decade.”…
=================================
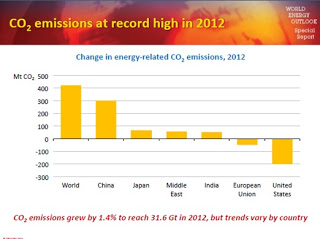
6/10/13, CO2 emissions chart from IEA report, p. 2

------------------------------------------
.
.
11/29/12, 134 scientists write to UN Sec. Gen. Ban Ki-Moon, asking him to desist from blaming climate disasters on global warming that hasn't happened: "Global warming that has not occurred cannot have caused the extreme weather of the past few years."...“The NOAA “State of the Climate in 2008”
report asserted that 15 years or more without any
statistically-significant warming would indicate a discrepancy between
observation and prediction. Sixteen years without warming have therefore now proven that the models are wrong by their creators’ own criterion.”…(2nd parag. fr. end of letter).…"Policy actions that aim to reduce CO2 emissions are unlikely
to influence future climate. Policies need to focus on preparation for,
and adaptation to, all dangerous climatic events, however caused."...Special to Financial Post, 12/10/12
.


No comments:
Post a Comment